
Business
sffis Explained: Farmer Credit Survey Guide

Introduction
A small farmer’s loan story is rarely just about money; it is about timing, risk, harvest pressure, household needs, and whether formal finance feels reachable. The Small Farmers and Fisherfolk Indebtedness Survey turns those scattered realities into evidence that policymakers, lenders, and agricultural planners can actually use. For anyone trying to understand rural credit, financial inclusion, or agricultural support in the Philippines, this survey is one of the clearest windows into what small producers face when they borrow.
sffis Overview: Key Details
| Aspect | Key Details |
|---|---|
| Full meaning | Small Farmers and Fisherfolk Indebtedness Survey |
| Main purpose | Measures borrowing behavior, credit needs, access to financial services, and barriers faced by small farmers and fisherfolk |
| Lead institution | Agricultural Credit Policy Council, with clearance from the Philippine Statistics Authority |
| Core audience | Policymakers, agricultural finance agencies, development researchers, lenders, cooperatives, and rural support organizations |
| Main topics covered | Loan sources, borrowing incidence, loan purpose, repayment status, savings, insurance, remittances, e-wallet use, and future credit needs |
| Why it matters | Helps improve affordable credit programs and guides planning for agriculture, fisheries, and rural financial inclusion |
| Common confusion | It is not a loan application, not a school name, and not the word “suffix” misspelled |
What Is the Small Farmers and Fisherfolk Indebtedness Survey?
The Small Farmers and Fisherfolk Indebtedness Survey is a nationwide data-gathering effort designed to understand how small producers borrow, where they get financing, and what prevents them from accessing fairer credit. It looks beyond the simple question of whether someone has debt and asks more useful questions: who lent the money, what the loan was used for, how repayment is going, and whether formal services are truly available in rural communities. That makes the survey valuable because agricultural debt is often shaped by crop cycles, fishing seasons, weather shocks, input prices, market access, and family emergencies.
The survey is especially important because small farmers and fisherfolk often operate with narrow margins and irregular cash flow. A loan may be used for seeds, fertilizer, fuel, nets, feeds, repairs, household expenses, transport, or income-generating work outside the farm or boat. When official data captures those patterns carefully, support programs can become less generic and more practical for the people they are meant to help.
Why Search Intent Around This Keyword Is Confusing
The keyword is short, so search engines can show mixed results. Some users are looking for the Philippine survey, while others may be landing on unrelated pages because of similar-looking terms such as SFIS, school acronyms, financial-system acronyms, or even dictionary results for “suffix.” That creates a content opportunity: the best article should define the acronym immediately, explain the official context, and remove confusion before going deeper.
This is also why keyword stuffing would hurt more than help. Readers searching this term likely want a fast answer first, then a deeper explanation if the page proves useful. A strong page should use the exact keyword lightly, then rely on related phrases such as small farmers, fisherfolk, indebtedness, agricultural credit, formal lending, financial inclusion, rural finance, and affordable credit access.
Why the Survey Matters for Rural Credit Policy
Rural credit policy can fail when it is designed from assumptions instead of field-level evidence. A farmer who borrows from a cooperative may face different problems from one borrowing from a trader, family member, microfinance institution, rural bank, or informal lender. The survey helps separate those realities so policymakers can see where credit access is improving, where it is still difficult, and which groups remain underserved.
The deeper value is not just counting borrowers. Good indebtedness data can reveal whether formal credit is reaching small producers, whether loan sizes match actual production costs, and whether financial services beyond credit are being used. Savings, insurance, remittance channels, and digital wallets all matter because a household with more financial options may be less dependent on expensive emergency borrowing.
What Information the Survey Collects
The survey typically looks at the respondent’s demographic background, farm or fishing operation, borrowing history, loan source, loan amount, repayment status, and purpose of borrowing. It can also examine access to non-credit financial services such as savings accounts, insurance, remittance facilities, and e-wallets. These categories matter because debt is only one part of a larger financial ecosystem.
A strong survey design also asks forward-looking questions. If small producers expect to need credit next year, policymakers need to know whether that demand is for production, household resilience, equipment, working capital, or alternative income. Without that forward view, credit programs can become reactive instead of prepared.
How the Survey Supports Better Lending Programs
Credit programs are often judged by how much money is released, but that is not the whole story. A program can look active on paper while still missing the people who need it most, offering the wrong repayment terms, or failing to match seasonal income patterns. Survey evidence can help agencies see whether lending programs are accessible, affordable, and suitable for real production cycles.
For example, small rice farmers, coconut growers, vegetable producers, livestock raisers, and fisherfolk may all need different loan structures. Some need short-term production loans, while others need working capital, post-harvest support, boat repair financing, or recovery funds after weather-related losses. When survey results are used well, lending becomes less about one-size-fits-all credit and more about fitting finance to livelihood patterns.
The Link Between Indebtedness and Financial Inclusion
Indebtedness is often treated as a negative word, but borrowing is not automatically bad. A well-timed, fairly priced loan can help a farmer buy inputs before planting or help a fisher repair equipment before peak season. The problem begins when credit is too expensive, too hard to access, poorly timed, or tied to unfair market arrangements.
That is why the survey’s focus on formal financial services is so important. Access to savings, insurance, remittances, and digital payments can reduce reliance on high-cost emergency loans. Financial inclusion is not only about opening accounts; it is about giving rural households usable tools that match their risks, income rhythm, and distance from formal institutions.
Why Respondent Participation Matters
For selected farmers and fisherfolk, participation may feel like another form to answer, but accurate responses can shape future programs. If respondents underreport borrowing, loan costs, or access barriers, decision-makers may assume the current system works better than it does. Honest answers help show where affordable credit is still missing and where existing programs need adjustment.
Participation also matters because rural communities are not financially identical. A coastal fisher, upland farmer, tenant producer, small livestock raiser, or market gardener may face different credit problems. The more accurately the survey captures those differences, the better chance public programs have of supporting the right people with the right tools.
What Competitor Pages Often Miss
Most existing pages explain that the survey was cleared, when data collection happened, and what the broad objectives are. That is useful, but it does not fully answer what ordinary readers want to know. A farmer, student, researcher, or local journalist may still ask: Is this a loan program? Why does borrowing data matter? How will the answers be used? What does this mean for rural financial inclusion?
A stronger article should bridge the gap between official language and practical meaning. It should explain that the survey is not merely a statistical exercise; it is a planning tool for credit access, program evaluation, and agricultural finance reform. That framing gives readers a clearer reason to care.
Common Misunderstandings About the Survey
The first misunderstanding is that the survey itself provides loans. It does not. It collects information that can help improve loan programs, credit policies, and financial access strategies, but answering the survey is not the same as applying for financing.
The second misunderstanding is that indebtedness data is only about debt problems. In reality, it can show both risk and opportunity. Borrowing patterns can reveal where small producers are investing, where they are vulnerable, and where formal lenders could design more suitable products.
The third misunderstanding is that formal credit automatically solves rural finance issues. Formal lenders can still be difficult to access if documentation is heavy, branches are far away, collateral requirements are unrealistic, or repayment schedules do not match farm and fishing income. The survey helps expose those practical barriers.
How Researchers and Policymakers Can Use the Data
Researchers can use the survey to study loan demand, credit constraints, borrowing sources, and the relationship between rural livelihoods and financial access. Policymakers can use it to improve agricultural finance programs, estimate demand for credit, and identify underserved groups. Development organizations can use the findings to design training, insurance, savings, and digital-finance interventions that fit local realities.
For planners, the most powerful use is comparison over time. When survey rounds are repeated, they can show whether formal credit access is improving, whether informal borrowing is falling, and whether small producers are becoming more financially resilient. That long-term view is hard to achieve through isolated reports or one-time consultations.
What a Better Rural Finance Strategy Should Learn From This Survey
A better strategy should begin with the real borrowing calendar of farmers and fisherfolk. Credit should arrive before production costs peak, not after the need has already passed. Repayment should reflect harvest, landing, and selling cycles instead of forcing households into unrealistic monthly schedules.
A better strategy should also combine credit with risk protection. Insurance, savings, emergency funds, buyer relationships, and financial literacy all influence whether a loan helps or hurts. When lenders and agencies treat credit as part of a wider support system, small producers are less likely to become trapped by debt.
Conclusion: 5 Actionable Takeaways
- Use the survey as a policy guide, not just a statistical report, because its value lies in improving real access to affordable rural finance.
- Read borrowing data together with savings, insurance, remittance, and digital-payment data, because credit behavior is part of a wider financial life.
- Treat farmers and fisherfolk as different borrower groups with different income cycles, risks, and loan-use patterns.
- Avoid assuming that formal credit access is solved just because programs exist, since distance, documents, collateral, timing, and trust still affect uptake.
- Encourage selected respondents to answer honestly, because accurate field data can lead to better-designed credit programs and stronger rural support.
FAQs
What does sffis stand for?
sffis stands for the Small Farmers and Fisherfolk Indebtedness Survey. It is a survey used to understand borrowing behavior, credit needs, loan sources, repayment conditions, and access to financial services among small farmers and fisherfolk.
Is the Small Farmers and Fisherfolk Indebtedness Survey a loan program?
No, the survey is not a loan program and does not directly give money to respondents. Its purpose is to collect data that can help government agencies and policymakers improve credit programs, financial services, and support systems for rural producers.
Who conducts the survey?
The survey is led by the Agricultural Credit Policy Council and cleared through the Philippine Statistics Authority’s survey review process. This clearance helps ensure that the survey design, data collection, and respondent burden follow official standards.
Why is the survey important for farmers and fisherfolk?
The survey is important because it gives small producers a way to be reflected in credit policy decisions. When their borrowing challenges and financial needs are measured accurately, agencies can design more practical, affordable, and accessible financing options.
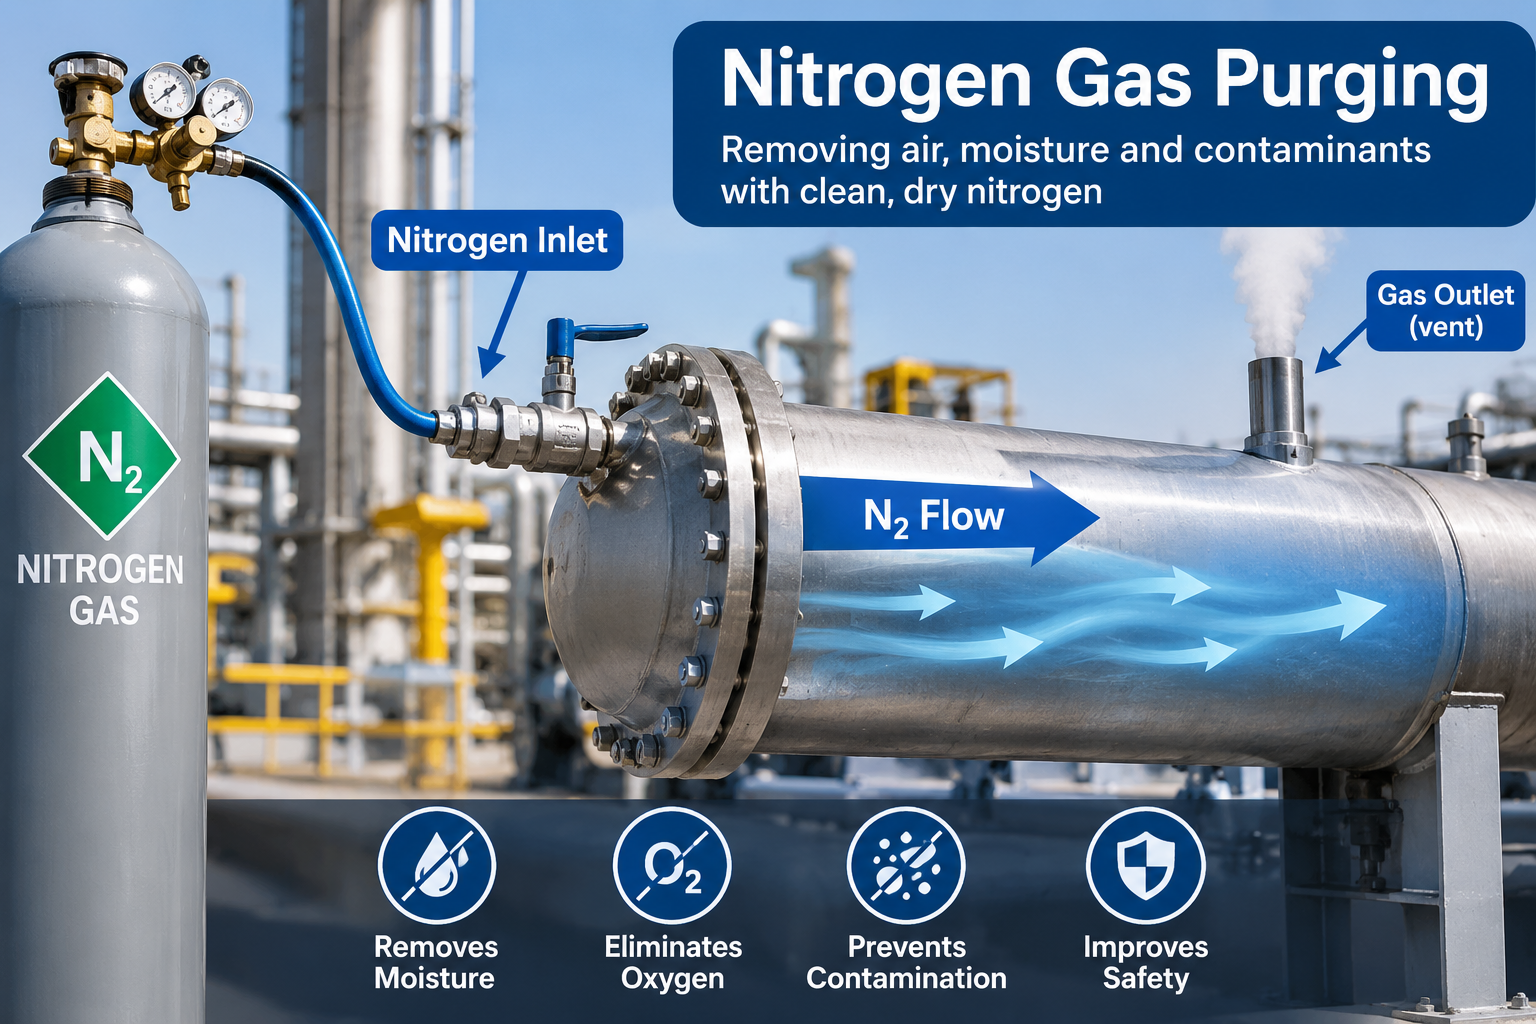
Nitrogen gas purging is an industrial process used to remove oxygen, moisture, flammable vapors, process gases, or other unwanted contaminants from pipelines, tanks, vessels, reactors, and process equipment. By introducing dry nitrogen into a system, operators can replace the existing atmosphere with a more stable, non-combustible environment.
The process is widely used during commissioning, shutdowns, maintenance, product changeovers, storage, and startup of chemical, oil and gas, pharmaceutical, food-processing, and manufacturing systems. Although the principle sounds straightforward, successful purging depends heavily on equipment geometry, flow conditions, pressure limits, vent locations, monitoring, and clearly defined acceptance criteria. Linde Gas
What Is Nitrogen Gas Purging?
Nitrogen gas purging is the controlled introduction of nitrogen into equipment to displace or dilute an unwanted internal atmosphere.
The material being removed may include:
- Oxygen
- Moisture and water vapor
- Hydrocarbon vapors
- Combustible gases
- Toxic process gases
- Reactive gases
- Residual process contaminants
Nitrogen is particularly useful because it is relatively inert under many industrial operating conditions, dry when supplied appropriately, widely available, and economical compared with gases such as argon or helium. Linde
The objective is not necessarily to physically clean dirt, scale, rust, or debris from equipment. Purging primarily changes the gas composition inside the system.
Quick Facts About Nitrogen Gas Purging
| Factor | Typical Purpose |
|---|---|
| Primary purge gas | Nitrogen (N₂) |
| Main objective | Replace or dilute unwanted gases |
| Common contaminants | Oxygen, moisture, hydrocarbons, toxic vapors |
| Typical equipment | Pipelines, tanks, vessels, reactors |
| Common methods | Displacement, dilution, pressure-cycle, vacuum, sweep |
| Verification | Oxygen, gas concentration, moisture or dew-point testing |
| Major hazard | Oxygen-deficient atmosphere |
| Common industries | Oil & gas, chemical, pharma, food, manufacturing |
Why Is Nitrogen Used for Purging?
Nitrogen makes up most of Earth’s atmosphere, but industrial purging uses a controlled nitrogen supply rather than simply introducing ambient air.
Several properties make it suitable.
Low Chemical Reactivity
Nitrogen does not readily react with many process materials under normal industrial conditions. Replacing oxygen-rich air with nitrogen can therefore help prevent oxidation and unwanted reactions.
Non-Combustible Atmosphere
Nitrogen does not support combustion.
When appropriately applied, it can reduce oxygen concentration sufficiently to prevent a flammable material from encountering enough oxidizer to sustain combustion. The required oxygen concentration depends on the process material and operating conditions rather than one universal percentage.
Low Moisture Content
Industrial nitrogen can be supplied very dry.
This makes nitrogen gas purging useful when equipment needs protection from moisture-related problems such as:
- Internal corrosion
- Product contamination
- Hydrate formation
- Process instability
- Moisture-sensitive reactions
Availability and Cost
Nitrogen is generally easier and less expensive to obtain in industrial quantities than argon or helium.
For that reason, nitrogen is commonly the preferred inert gas for large pipelines, storage systems, reactors, and process facilities. Linde
How Nitrogen Gas Purging Works
The basic concept involves introducing nitrogen at one location while removing the original atmosphere through another path.
A simplified process is:
Nitrogen supply → pressure/flow control → equipment → displaced gas → controlled vent or recovery system
What happens inside the equipment depends on the selected purging method.
Some methods attempt to push the original gas out with minimum mixing. Others deliberately mix nitrogen with the existing gas and progressively reduce its concentration.
The purge continues until measurements confirm that the predefined endpoint has been reached.
Main Nitrogen Gas Purging Methods
There is no single purging technique suitable for every system. Equipment geometry, pressure rating, process hazards, nitrogen availability, vent arrangements, and required final concentration all influence method selection.
Common approaches include displacement, dilution, pressure-cycle, vacuum, and sweeping purges. Presscon
1. Displacement Purging
Displacement purging introduces nitrogen from one side of a system while allowing the original gas to leave through another opening.
Ideally, nitrogen forms a moving interface that pushes the existing atmosphere ahead of it with limited mixing.
Best suited for:
- Long pipelines
- Relatively simple pipe runs
- Tall vessels
- Systems with well-positioned inlet and vent points
Advantages
- Potentially low nitrogen consumption
- Simple operating principle
- Efficient when good plug-flow behavior occurs
Limitations
Complex geometry can create:
- Dead legs
- Gas pockets
- Recirculation zones
- Short-circuiting
- Excessive mixing
If these occur, the apparent outlet concentration may not represent every part of the system.
Gas density and purge velocity must also be considered because poor flow conditions can lead to stratification rather than effective displacement. IGEM
2. Dilution Purging
Dilution purging intentionally mixes nitrogen with the existing internal atmosphere.
As nitrogen continuously enters and the mixed gas leaves, the concentration of oxygen or another unwanted constituent progressively decreases.
It is often used where maintaining a clean gas-to-gas interface is impractical.
Advantages
- Works with more complicated geometries
- Suitable for many vessels
- Relatively straightforward to operate
Limitations
Because mixing occurs, significantly more than one equipment volume of nitrogen may be required.
Poor outlet positioning can also produce short-circuit flow, where nitrogen travels directly from the inlet to the vent while stagnant regions remain insufficiently purged. JMS Consultants
3. Pressure-Cycle Purging
Pressure-cycle purging is commonly used for closed systems capable of safely accepting pressure.
The basic sequence is:
- Introduce nitrogen and raise system pressure.
- Allow sufficient time for mixing if required.
- Depressurize through an approved vent route.
- Repeat the cycle.
- Test the atmosphere.
- Continue until the required endpoint is achieved.
Each cycle removes part of the remaining original atmosphere.
This method can be highly effective for vessels and closed piping sections because the concentration reduction can be estimated mathematically.
However, nitrogen pressure must always remain within the engineering limits of the weakest component in the system.
4. Vacuum Purging
Vacuum purging begins by removing part of the existing atmosphere with a vacuum system.
Nitrogen is then introduced to refill the evacuated space.
The sequence may be repeated several times:
Evacuate → nitrogen backfill → evacuate → nitrogen backfill
Vacuum purging can significantly reduce nitrogen consumption in suitable equipment because much of the original gas is physically removed before nitrogen enters.
It is particularly useful where equipment is specifically designed to tolerate vacuum conditions. Linde Gas
Not every vessel can safely withstand an internal vacuum, so equipment design pressure must be verified before using this technique.
5. Sweep Purging
Sweep purging uses a continuous, usually low-pressure nitrogen flow through the system.
Nitrogen enters one location while gas continuously exits through another.
It can be useful for:
- Storage systems
- Flare-related equipment
- Small process vessels
- Maintaining low oxygen conditions
- Preventing atmospheric ingress during standby
Unlike a one-time purge, sweeping can also be maintained for extended periods. Presscon
Comparison of Nitrogen Purging Methods
| Method | Principle | Nitrogen Use | Suitable Equipment | Key Concern |
|---|---|---|---|---|
| Displacement | Pushes existing gas out | Low to moderate | Pipelines, simple vessels | Mixing and stratification |
| Dilution | Mixes and progressively dilutes | Moderate to high | Complex vessels | Dead zones |
| Pressure-cycle | Pressurize and vent repeatedly | Moderate | Closed pressure-rated systems | Pressure limits |
| Vacuum | Evacuate then backfill | Potentially low | Vacuum-rated vessels | Collapse risk |
| Sweep | Continuous nitrogen flow | Continuous | Tanks, piping, standby systems | Ventilation and nitrogen usage |
Step-by-Step Nitrogen Gas Purging Procedure
Actual procedures must be developed for the specific plant and equipment. A typical engineering workflow includes the following stages.
Step 1: Define the Purging Objective
Before introducing nitrogen, determine exactly what must be accomplished.
Examples include:
- Reducing oxygen before introducing hydrocarbons
- Removing hydrocarbon vapor before maintenance
- Drying a pipeline
- Removing moisture before startup
- Protecting equipment from oxidation
- Creating an inert atmosphere for storage
A purge without a measurable endpoint is difficult to verify.
Step 2: Establish Acceptance Criteria
Define what constitutes successful completion.
Possible criteria include:
- Maximum oxygen concentration
- Maximum hydrocarbon concentration
- Minimum nitrogen concentration
- Required dew point
- Maximum moisture content
- Required contaminant concentration
The correct value depends on the process, material involved, applicable engineering standards, and operating procedure.
Do not assume that a generic oxygen percentage is safe for every combustible material.
Step 3: Determine Internal Volume
Calculate the internal volume of:
- Pipes
- Vessels
- Tanks
- Filters
- Heat exchangers
- Connected equipment
- Dead legs and branches
Accurate system volume is essential for estimating nitrogen requirements.
Step 4: Review the System Configuration
Confirm:
- Nitrogen injection point
- Vent location
- Isolation boundaries
- Valve positions
- Pressure relief protection
- Instrument connections
- Sample points
- Check valves
- Drains
- Dead legs
- Temporary hoses and fittings
An overlooked branch may remain filled with air even when the main system appears adequately purged.
Step 5: Select the Purging Method
Choose the technique that fits the system.
For example:
- Long simple pipe → displacement may be efficient.
- Complex vessel → dilution may be more reliable.
- Closed pressure-rated vessel → pressure cycling may work well.
- Vacuum-rated reactor → evacuation/backfill may minimize nitrogen.
- Standby vessel → continuous sweep may be appropriate.
Step 6: Connect and Control the Nitrogen Supply
Nitrogen may be supplied from:
- Cylinders
- Cylinder bundles
- Liquid-nitrogen vaporizers
- Bulk nitrogen tanks
- Nitrogen generators
Pressure regulators and flow-control equipment must be correctly sized.
Introducing nitrogen too rapidly can create excessive pressure, turbulence, static effects, temperature changes, or ineffective gas distribution.
Step 7: Establish a Safe Vent Route
Displaced gases must go somewhere.
Depending on what is being removed, vent gas may need to be directed to:
- A flare
- Vapor recovery
- Scrubbing equipment
- Treatment equipment
- A designated outdoor discharge point
Never assume venting is harmless simply because nitrogen is being introduced. The outgoing gas may contain flammable, toxic, corrosive, or oxygen-deficient mixtures.
Step 8: Start Nitrogen Flow
Begin according to the approved procedure.
Operators should monitor relevant parameters such as:
- Nitrogen pressure
- Flow rate
- System pressure
- Vent behavior
- Oxygen concentration
- Process-gas concentration
Any abnormal pressure rise should be investigated immediately.
Step 9: Sample at Representative Locations
Outlet concentration is important, but a single sample can be misleading.
Where practical, sample locations should account for:
- High points
- Low points
- Long branches
- Dead legs
- Remote ends
- Large-volume components
This is particularly important in complicated piping networks.
Step 10: Confirm the Endpoint
Purging should stop only when measured results meet the predefined criteria.
Measurement is safer and more reliable than simply assuming that a certain amount of nitrogen guarantees completion.
How Much Nitrogen Is Required for Purging?
Nitrogen consumption depends strongly on the selected method.
For an idealized perfectly mixed dilution purge, contaminant concentration approximately follows:
\[ C = C_0 e^{-N} \]Where:
- \(C\) = final concentration
- \(C_0\) = initial concentration
- \(N\) = number of system-volume exchanges
Rearranging:
\[ N = \ln\left(\frac{C_0}{C}\right) \]Suppose the initial oxygen concentration is approximately 20.9% and the target is 1%.
\[ N = \ln(20.9/1) \]\[ N \approx 3.04 \]Under ideal complete-mixing assumptions, roughly three system volumes would theoretically be required.
Real systems are not ideal.
Dead legs, imperfect mixing, equipment internals, nitrogen purity, leaks, sampling position, pressure, temperature, and flow behavior usually require an engineering margin and actual concentration verification.
Pressure-Cycle Purging Calculation
Pressure purging can also be estimated mathematically.
Assuming complete mixing and absolute pressures, the remaining concentration after each pressurization and vent cycle can be approximated using the pressure ratio.
A simplified relationship is:
\[ C_n = C_0\left(\frac{P_L}{P_H}\right)^n \]Where:
- \(C_n\) = concentration after \(n\) cycles
- \(C_0\) = initial concentration
- \(P_L\) = lower absolute pressure
- \(P_H\) = upper absolute pressure
- \(n\) = number of cycles
Using absolute pressure, rather than gauge pressure, is essential in this type of calculation.
Calculations should support field measurements rather than replace them.
Nitrogen Purging vs Nitrogen Blanketing
These terms are related but describe different operations.
Nitrogen Purging
Purging generally removes or replaces the existing atmosphere.
It is frequently performed during:
- Commissioning
- Startup
- Shutdown
- Maintenance preparation
- Product changeover
Nitrogen Blanketing
Blanketing maintains an inert atmosphere after the required internal condition has already been established.
For example, nitrogen may be continuously supplied to a storage tank headspace as liquid is withdrawn so outside air does not enter.
Linde describes purging as the replacement of the vessel atmosphere and blanketing as maintaining the protective inert atmosphere afterward. Linde Gas
Nitrogen Purging vs Inerting
Inerting is the broader objective of creating an atmosphere that minimizes unwanted reactions or combustion.
Nitrogen purging is one technique used to achieve that objective.
In simple terms:
Purging = the operation.
Inerting = the condition or safety objective.
Nitrogen Purging vs Flushing
Purging and flushing are also frequently confused.
Purging primarily changes the gas atmosphere.
Flushing generally uses gas or liquid velocity to remove physical contaminants such as:
- Dirt
- Construction debris
- Loose rust
- Scale
- Residual chemicals
A commissioning program may therefore include cleaning, flushing, drying, and nitrogen purging as separate operations.
Major Applications of Nitrogen Gas Purging
Oil and Gas Pipelines
Pipelines may be nitrogen purged before introducing natural gas or hydrocarbons.
During shutdown, nitrogen can also provide an inert intermediate atmosphere while hydrocarbons are removed.
This helps prevent direct formation of a combustible hydrocarbon-air mixture within the system.
Chemical Processing
Reactors, vessels, piping, and storage tanks often require purging before:
- Startup
- Shutdown
- Catalyst handling
- Maintenance
- Product transitions
Reducing oxygen can help prevent unwanted oxidation and combustion. Linde
Refineries and Petrochemical Plants
Nitrogen is commonly used during turnaround and commissioning work involving:
- Process columns
- Reactors
- Separators
- Compressors
- Storage systems
- Transfer piping
Pharmaceutical Manufacturing
Pharmaceutical processes may use nitrogen to control:
- Oxygen exposure
- Moisture
- Oxidation
- Product contamination
Purging may also be applied to reactors and process equipment containing oxygen-sensitive substances. Linde
Food and Beverage Processing
Nitrogen can help limit oxygen exposure that contributes to:
- Oxidation
- Flavor deterioration
- Color changes
- Product degradation
Welding and Fabrication
Nitrogen or another inert gas may be used in suitable applications to protect the opposite side of certain welds from atmospheric exposure.
Gas selection must match the metallurgy and welding procedure because nitrogen is not suitable for every alloy.
Electronics and Semiconductor Manufacturing
Low-oxygen, low-moisture environments are important in various precision manufacturing operations.
Very high-purity nitrogen may therefore be used for controlled process atmospheres and equipment purging.
Why Oxygen Concentration Matters
Many industrial purges are performed to reduce oxygen before introducing a combustible material.
However, the appropriate limit should be determined from the limiting oxidant concentration (LOC) or another engineering criterion relevant to the actual combustible material.
LOC varies with factors including:
- Fuel composition
- Temperature
- Pressure
- Inert gas
- Process conditions
For that reason, rules such as “below X% oxygen is always safe” should not be treated as universal.
Nitrogen Gas Purging Safety Hazards
Nitrogen is useful because it displaces oxygen.
That same property makes it dangerous to people.
Oxygen Deficiency
Nitrogen is colorless and odorless. A worker usually cannot detect an oxygen-deficient atmosphere by smell or sight.
OSHA identifies nitrogen as a simple asphyxiant and warns that improper workplace use can cause serious injury or death. OSHA
Dangerous nitrogen accumulation can occur around:
- Tanks
- Vessels
- Trenches
- Pits
- Buildings
- Pipe racks
- Temporary enclosures
- Poorly ventilated process areas
Never Use Human Senses as a Detector
You cannot reliably smell nitrogen enrichment.
Atmospheric monitoring should be used where an oxygen-deficiency hazard may exist.
Vent Location Matters
A poorly selected vent can discharge large quantities of oxygen-deficient gas into a work area.
Vent points should therefore be selected through a hazard assessment rather than simply choosing the closest available opening.
Pressure Hazards
Nitrogen systems can generate substantial pressure.
Possible consequences include:
- Hose failure
- Fitting failure
- Vessel overpressure
- Pipe movement
- Equipment damage
Pressure relief and regulation must be suitable for the maximum possible nitrogen supply pressure.
Cryogenic Nitrogen Hazards
Where liquid nitrogen is vaporized to produce gaseous nitrogen, additional hazards include extremely low temperatures.
Direct contact can cause serious cold burns, and liquid-to-gas expansion can generate very large gas volumes.
Confined Space Hazards
Nitrogen purging and confined-space entry require extremely careful coordination.
A vessel deliberately made oxygen-deficient for inerting is obviously incompatible with normal human entry unless it has subsequently been safely prepared and verified under the facility’s entry procedures.
Essential Safety Controls
A professional nitrogen gas purging plan commonly addresses:
- Approved written procedure
- Job hazard analysis
- Isolation and lockout/tagout
- Pressure limits
- Pressure relief
- Nitrogen regulator capacity
- Flow-control requirements
- Secure hose connections
- Gas-detection equipment
- Oxygen monitoring
- Vent routing
- Restricted access zones
- Warning signs
- Communication arrangements
- Emergency response
- Required personal protective equipment
Workers must also understand that nitrogen itself may present no smell or irritation before unconsciousness from oxygen deprivation occurs.
Common Nitrogen Purging Mistakes
Assuming One System Volume Is Enough
One internal volume of nitrogen does not automatically equal a complete purge.
Mixing and stagnant zones can leave significant contaminants behind.
Relying Only on Time
“Purged for 30 minutes” is not a meaningful acceptance criterion unless flow, system volume, configuration, and measured concentration are also understood.
Sampling Too Close to the Outlet
Nitrogen may find a preferential flow path from inlet to outlet.
The outlet could therefore show a good reading while remote branches still contain air.
Ignoring Dead Legs
Closed branches and instrument connections are frequent sources of trapped atmosphere.
They should be included in the purge plan.
Using Gauge Pressure in Purge Calculations
Pressure-ratio calculations require absolute pressures.
Using gauge pressure can significantly distort the predicted number of purge cycles.
Excessively High Flow
More nitrogen flow does not always mean better purging.
High velocity may increase turbulence and mixing during a displacement purge, making the operation less efficient.
No Defined Completion Criterion
Operators need a measurable endpoint before starting.
Otherwise, nitrogen may be wasted or the purge may be stopped prematurely.
How to Improve Nitrogen Purging Efficiency
Position Inlet and Outlet Strategically
Good purge performance begins with gas-flow design.
The inlet and outlet should encourage nitrogen to travel through the full internal volume rather than directly short-circuiting between two nearby connections.
Minimize Unnecessary Mixing
For displacement purging, maintain conditions that preserve a relatively stable interface.
Excessive turbulence increases nitrogen consumption.
Segment Large Systems
Instead of purging an enormous piping network simultaneously, dividing it into controlled sections may produce:
- Better flow control
- Faster verification
- Lower nitrogen consumption
- Easier troubleshooting
Monitor Instead of Guessing
Portable or fixed instrumentation can greatly improve purge reliability.
Depending on the objective, useful measurements include:
- Oxygen concentration
- Hydrocarbon concentration
- Moisture
- Dew point
- Specific process contaminants
Check for Rebound
When drying equipment, a low outlet moisture reading does not always prove the entire system is dry.
Moisture trapped in internal surfaces or dead legs may later desorb and increase the reading again. Holding and retesting can reveal this type of rebound. Front End Engineering Consultancy
Choosing a Nitrogen Supply
The appropriate nitrogen source depends on system volume, required flow rate, purity, duration, and site logistics.
Nitrogen Cylinders
Suitable for:
- Small equipment
- Laboratory systems
- Small piping volumes
They become inefficient when very large quantities are required.
Cylinder Bundles
Provide more capacity than individual cylinders while remaining relatively portable.
Liquid Nitrogen and Vaporizer
Large projects often use liquid nitrogen that is converted into gaseous nitrogen through a vaporizer.
This configuration can provide high flow rates for major pipelines and vessels.
On-Site Nitrogen Generation
Membrane or pressure-swing adsorption systems can produce nitrogen continuously where the required purity and capacity are compatible with the application.
Generation can be economical for facilities with frequent nitrogen demand.
What Nitrogen Purity Is Needed?
Not every purge requires ultra-high-purity nitrogen.
The required purity depends on:
- Target oxygen concentration
- Product sensitivity
- Moisture requirements
- Process chemistry
- Contaminant tolerance
- Safety objective
Using unnecessarily high purity can increase cost without improving the outcome.
Conversely, insufficient nitrogen purity may prevent the desired endpoint from ever being reached.
Environmental and Cost Considerations
Nitrogen itself is a major natural component of the atmosphere, but purging can still have environmental and operating impacts.
The displaced gas may contain:
- Hydrocarbons
- Volatile organic compounds
- Toxic substances
- Greenhouse gases
- Process chemicals
Consequently, the environmental concern may relate more to what is being vented than to the nitrogen.
Efficient purge design can also reduce:
- Nitrogen consumption
- Vaporizer capacity requirements
- Truck deliveries
- Purging time
- Vent emissions
- Overall commissioning costs
Frequently Asked Questions
What is nitrogen gas purging used for?
Nitrogen gas purging is used to remove oxygen, moisture, hydrocarbons, toxic gases, or other unwanted atmospheres from piping, tanks, vessels, reactors, and similar equipment.
Does nitrogen remove oxygen?
Nitrogen does not chemically destroy oxygen during normal purging. It physically displaces or dilutes oxygen until the concentration reaches the required level.
How long does nitrogen purging take?
There is no universal duration.
Purge time depends on equipment volume, nitrogen flow, pressure, geometry, purge method, initial concentration, and target concentration.
How many volumes of nitrogen are needed?
Displacement purging may approach relatively low volume requirements under ideal conditions, while dilution purging often requires several volume exchanges.
The correct requirement should be calculated and confirmed by measurement.
Is nitrogen gas dangerous?
Nitrogen is non-toxic, but concentrated nitrogen can displace breathable oxygen and create a potentially fatal asphyxiation hazard. OSHA specifically identifies this workplace risk. OSHA
What oxygen level should be reached during nitrogen purging?
The required oxygen concentration depends on the purpose of the purge.
For combustible systems, the target should be established from relevant process safety criteria such as the applicable limiting oxidant concentration, engineering standard, or approved operating procedure rather than an arbitrary universal value.
Can nitrogen purging remove moisture?
Yes. Dry nitrogen can remove water vapor and help dry piping or vessels, although liquid water may first require draining, blowing, heating, vacuum drying, or another dedicated drying method.
Is nitrogen purging the same as nitrogen blanketing?
No. Purging replaces an unwanted atmosphere, while blanketing generally maintains an inert atmosphere after it has been established.
Conclusion
Nitrogen gas purging is one of the most versatile techniques for controlling internal atmospheres in industrial piping, tanks, reactors, and process equipment. When properly engineered, it can remove oxygen, moisture, hydrocarbons, and other unwanted gases while preparing equipment for startup, shutdown, maintenance, storage, or product introduction.
Successful nitrogen gas purging depends on more than simply connecting a nitrogen supply and opening a valve. The purge method must match the equipment geometry, nitrogen flow and pressure must remain controlled, dead legs and vent routes must be considered, and completion should be confirmed using appropriate gas or moisture measurements. Most importantly, nitrogen’s ability to displace oxygen makes atmospheric monitoring, ventilation, controlled venting, and worker protection essential parts of every professional purging operation.
The EIBC conference is an international academic event focused on economics, international business, and cross-cultural communication. Hosted by the Faculty of Economics and Business Administration at Alexandru Ioan Cuza University of Iași, Romania, it brings together researchers, academics, practitioners, doctoral candidates, and students interested in sharing research and building international collaborations.
The sixth edition, EIBC 2026, took place from June 11–13, 2026, in Iași, Romania. The organizers positioned the event not only as a place to present academic work, but also as a platform for developing research and teaching cooperation between participants from Romania and other countries.
If you’re considering a future edition, this guide explains what the EIBC conference is, who should attend, how submissions work, what publication opportunities may be available, and how to get more value from participating.
EIBC Conference Quick Facts
| Detail | EIBC 2026 Information |
|---|---|
| Full name | International Conference Economics, International Business and Cross-Cultural Communication |
| Common abbreviation | EIBC |
| 2026 edition | Sixth edition |
| Dates | June 11–13, 2026 |
| Location | Iași, Romania |
| Host | Alexandru Ioan Cuza University of Iași |
| Faculty | Faculty of Economics and Business Administration |
| Main audience | Academics, researchers, practitioners, PhD candidates and students |
| Student session | Yes |
| Conference proceedings | Available as a publication route |
| Proceedings ISSN | 2810-4625 |
| 2026 abstract/paper deadline | May 17, 2026 |
| 2026 author registration deadline | May 31, 2026 |
The 2026 dates have already passed, so prospective participants should verify the official conference website for announcements concerning a subsequent edition rather than assuming the same deadlines will apply again.
What Is the EIBC Conference?
EIBC stands for Economics, International Business and Cross-Cultural Communication.
The conference is organized by the Department of Economics and International Relations within the Faculty of Economics and Business Administration at Alexandru Ioan Cuza University of Iași. Its purpose is to connect scholars with overlapping research interests and create opportunities for further cooperation in research and teaching.
That interdisciplinary focus is important. Modern economic and business questions rarely exist within a single academic silo.
International trade, multinational management, migration, digitalization, consumer behavior, sustainability, economic policy, cultural differences, and global communication frequently overlap. A conference built around economics, international business, and cross-cultural communication provides space for examining those connections.
Who Should Attend the EIBC Conference?
The EIBC conference is especially relevant for people working in economics, business, international relations, management, communication, and related social-science fields.
Potential participants include:
- University researchers and teaching staff
- Economics and business scholars
- PhD candidates
- Master’s and undergraduate students
- International-business researchers
- Cross-cultural communication specialists
- Practitioners interested in academic discussion
- Early-career researchers seeking presentation experience
- Scholars looking for international research collaborators
The 2026 program also included a dedicated student session and a debate, broadening the event beyond traditional research-paper presentations.
Is It Suitable for PhD Students?
Yes.
For a doctoral researcher, a conference like EIBC can serve several purposes at once. You can test an argument before submitting it to a journal, receive questions from people outside your immediate research group, and meet academics working on related problems.
Presenting also forces you to explain your research concisely. That skill becomes valuable when defending a dissertation, writing abstracts, applying for grants, interviewing for academic positions, or discussing research with interdisciplinary audiences.
Is It Suitable for Master’s and Undergraduate Students?
Potentially, especially where a dedicated student session is offered.
For the 2026 edition, undergraduate and master’s students participating in the student session could attend without a conference fee.
Students should still treat participation professionally. A student presentation can become an early piece of academic experience for a CV, but the greatest value often comes from learning how research is discussed, questioned, defended, and improved.
Main Academic Areas Covered by EIBC
The conference’s title identifies three broad pillars.
Economics
Research may address economic systems, public policy, development, markets, finance, labor, institutions, regional economies, European economic issues, or other questions connected to economic behavior and policy.
A strong submission usually goes beyond describing an economic trend. It should identify a clear research question and explain why the evidence contributes something useful to the existing literature.
International Business
International-business research can explore issues such as:
- Internationalization
- Foreign investment
- Export strategies
- Multinational enterprises
- Global supply chains
- International entrepreneurship
- Business competitiveness
- Market entry
- Global management
- Institutional differences between markets
This area naturally overlaps with economics because international business decisions are shaped by exchange rates, regulation, market conditions, trade policy, labor availability, technology, and political risk.
Cross-Cultural Communication
Cross-cultural research examines what happens when people, firms, institutions, or consumers operate across cultural environments.
Potential areas include international negotiation, workplace communication, intercultural management, consumer behavior, organizational culture, global teams, education, migration, and communication across linguistic or social contexts.
The strongest studies usually avoid treating culture as a vague explanation. Instead, they define cultural variables clearly and connect them to observable behaviors, decisions, or outcomes.
Why Researchers Attend Conferences Like EIBC
Publishing a paper is only one possible benefit of academic conference participation.
Get Feedback Before Journal Submission
A presentation exposes your research to questions that may reveal weak assumptions, unclear explanations, missing literature, or alternative interpretations.
That feedback can be particularly valuable before submitting a manuscript to peer review.
Build an International Academic Network
EIBC specifically emphasizes cooperation among academic peers from Romania and abroad.
Conferences make it easier to identify researchers working on similar questions. A conversation after a session can eventually develop into a joint paper, research proposal, visiting opportunity, workshop, or teaching collaboration.
Improve Research Communication
Writing a 7,000-word paper and explaining the same study in a short presentation are completely different skills.
Conference presentations teach researchers to identify the core message:
What problem did you investigate, what did you find, and why should anyone care?
That discipline often improves the eventual paper as well.
Discover New Research Questions
Some of the most useful ideas at a conference come from sessions outside your immediate specialization.
A researcher studying international trade, for example, might discover a cross-cultural variable that improves the theoretical explanation of observed business behavior.
EIBC Conference Submission Process
For EIBC 2026, authors could submit an extended abstract or full paper by May 17, 2026. Acceptance notifications were scheduled for May 24, followed by author registration and fee payment by May 31.
The conference itself took place from June 11–13, while full papers intended for publication were due by July 20, 2026. The organizers also specified a maximum of two papers per author.
Because those deadlines applied specifically to the 2026 edition, future applicants should not reuse them when planning for another year.
2026 Submission Timeline
| Stage | Deadline |
|---|---|
| Extended abstract or full-paper submission | May 17, 2026 |
| Acceptance notification | May 24, 2026 |
| Author registration and payment | May 31, 2026 |
| Conference | June 11–13, 2026 |
| Full paper for publication | July 20, 2026 |
How to Prepare a Strong EIBC Submission
Getting the topic right is only the beginning.
1. Start With a Precise Research Problem
Avoid beginning with an enormous subject such as:
“Digitalization and international business.”
Narrow it into a researchable question.
For example, you might investigate how a particular form of digital adoption affects export performance within a defined industry, country group, or type of company.
2. Explain the Research Gap Early
A conference reviewer should not have to reach the final page to understand why your study matters.
Your introduction should quickly establish:
- What researchers already know
- What remains uncertain
- Why that uncertainty matters
- How your study addresses it
3. Match the Method to the Question
Do not choose a complicated method simply because it appears sophisticated.
A clear regression model answering a meaningful question is usually stronger than an unnecessarily complex model that the author cannot justify.
Qualitative research needs the same discipline. Explain participant selection, data collection, coding, analytical procedures, and limitations clearly.
4. Make the Contribution Explicit
A useful test is whether you can complete this sentence:
“This study contributes to existing research by…”
If completing that sentence is difficult, your contribution probably needs more work.
5. Edit the Abstract Aggressively
The abstract may be the first substantive part reviewers examine.
Remove background material that doesn’t directly support the research problem. Give more space to the objective, methodology, results, and contribution.
A Practical Abstract Structure
Researchers can use this structure when preparing an academic conference abstract:
- Context: Introduce the specific problem.
- Gap: Identify what remains unresolved.
- Objective: State exactly what the study investigates.
- Method: Explain data, sample, variables, or analytical approach.
- Results: Report the main finding where the research is complete.
- Contribution: Explain what the finding adds.
- Implication: State why it matters academically or practically.
A common mistake is spending half the abstract explaining the topic and only one sentence discussing the actual research.
Reverse that balance.
Publication Opportunities Connected With EIBC
Publication can be an important consideration for researchers choosing a conference.
For the 2026 edition, organizers listed several possible publication outlets, including:
- CES Working Papers
- Review of Economic and Business Studies
- Scientific Annals of Economics and Business
- Virgil Madgearu Review of Economic Studies and Research
- The USV Annals of Economics and Public Administration
- Conference Proceedings: Economics, International Business and Cross-Cultural Communication
The conference proceedings are published by Alexandru Ioan Cuza University Press and carry ISSN 2810-4625.
Importantly, presentation at the conference does not automatically guarantee journal publication. The official information states that submissions intended for the listed journals undergo the regular review process of the selected publication.
Conference Presentation vs. Journal Publication
These should be treated as separate stages.
| Conference Presentation | Journal Publication |
|---|---|
| Presents research to attendees | Produces a formal scholarly publication |
| Usually shorter and more conversational | Requires a complete manuscript |
| Provides direct feedback | Usually involves formal peer review |
| Helps refine arguments | Requires responses to reviewer comments |
| Good for networking | Important for academic publication records |
The best strategy is often to use conference feedback to strengthen the manuscript before journal review.
EIBC Conference Fees
For EIBC 2026, registration fees were:
- Researchers, academics and practitioners: 450 Romanian lei
- PhD students: 300 Romanian lei
- Undergraduate and master’s students attending the student session: Free
The reduced PhD fee applied when all authors were doctoral students.
According to the organizer, the fee covered access to conference sessions, a certificate of attendance, the conference kit, printed program, coffee breaks, and meals.
Future editions may use different prices, so these figures should be treated as historical 2026 information rather than permanent fees.
How to Prepare Your EIBC Conference Presentation
An accepted paper is only half the job. The next challenge is explaining it well.
Build the Presentation Around One Main Argument
Do not attempt to reproduce your entire manuscript on slides.
Most research presentations can be organized around:
- Problem
- Research question
- Data or methodology
- Two or three main findings
- Interpretation
- Contribution
- Implications
Everything else is supporting material.
Show Results Visually
Dense statistical tables are difficult to absorb during a live talk.
Where possible, convert the central findings into:
- Simple charts
- Coefficient plots
- Diagrams
- Comparison tables
- Conceptual frameworks
Keep detailed robustness results available as backup slides.
Prepare for Questions
Before presenting, write down the five questions you would least like somebody to ask.
Then prepare answers.
Questions often involve:
- Sample selection
- Causality
- Generalizability
- Variable definitions
- Model specification
- Missing literature
- Alternative explanations
- Practical implications
Preparing for difficult questions usually improves the paper itself.
How to Network Effectively at EIBC
Networking should not mean collecting the largest possible number of business cards or LinkedIn connections.
A better target is three to five meaningful academic conversations.
Before the Conference
Review the program when it becomes available and identify researchers whose work genuinely overlaps with yours.
Read at least one recent publication from the people you most want to meet.
That makes the opening conversation much easier:
“I’ve been working on a related question, and your research on X gave me a different way of thinking about Y.”
That is significantly better than simply asking someone what they research.
During the Conference
Ask specific questions after presentations.
Instead of:
“Interesting presentation. Can you tell me more?”
Try:
“You found a stronger effect among smaller firms. Do you think financing constraints could explain part of that difference?”
Specific questions create real academic conversations.
After the Conference
Follow up within several days.
Mention what you discussed rather than sending a generic networking message. If you agreed to share a paper, dataset reference, or other resource, send it promptly.
Common Mistakes to Avoid
Researchers can improve their conference experience simply by avoiding predictable errors.
Submitting a Topic Instead of a Study
“Artificial intelligence in international business” is a topic.
A conference contribution needs a research problem, question, methodology, evidence, or defensible conceptual argument.
Ignoring the Conference Scope
A technically excellent paper can still be a poor submission if the connection with economics, international business, or cross-cultural communication is unclear.
Explain the fit explicitly.
Assuming Acceptance Means Publication
Conference acceptance and journal publication are different processes.
EIBC’s official information makes clear that papers submitted to associated journals are subject to those journals’ normal review procedures.
Reading Slides Word for Word
Audiences can read faster than speakers can talk.
Slides should support your explanation rather than become your script.
Waiting Until the Conference to Network
Some of the best conversations can be prepared before arrival by studying the program and identifying relevant scholars.
Trying to Promote Yourself to Everyone
Academic networking works best when it begins with shared research interests rather than self-promotion.
How to Decide Whether the EIBC Conference Is Worth Attending
Before registering for a future EIBC edition, evaluate it against your actual goals.
Ask yourself:
- Does my research fit economics, international business, or cross-cultural communication?
- Are relevant researchers likely to attend?
- Do I need feedback on a working paper?
- Would presenting strengthen my academic development?
- Am I interested in one of the available publication pathways?
- Can my university or research project cover travel and registration?
- Could the conference support future research collaboration?
If the answer to several of these questions is yes, EIBC may offer more value than simply adding another conference presentation to your CV.
How Early Should You Start Preparing?
Ideally, preparation should begin several months before the submission deadline.
Three to Six Months Before Submission
Develop the research question, literature review, methodology, and data strategy.
One to Two Months Before Submission
Complete the main analysis and begin drafting the paper or extended abstract.
Two Weeks Before Submission
Edit the argument, verify references, check tables and figures, and ask a supervisor or colleague to review the abstract.
After Acceptance
Build the presentation and revise the manuscript using any weaknesses you noticed while preparing the talk.
This approach prevents a common academic problem: submitting unfinished research simply because a deadline suddenly appears.
What Makes EIBC Different From a Generic Business Conference?
EIBC should primarily be understood as an academic and research-oriented conference, not a large commercial exhibition or general networking event.
Its value comes from the intersection of three connected fields: economics, international business, and cross-cultural communication.
That creates opportunities for interdisciplinary research.
For example, a study about foreign-market entry may begin as an international-business question but also require economic analysis and consideration of cultural differences. EIBC’s structure gives such work a natural setting.
Questions to Ask Before Registering for a Future Edition
Conference details can change from year to year. Before paying or booking travel, confirm:
- Current conference dates
- Submission deadline
- Abstract format
- Full-paper requirements
- Presentation format
- Conference language
- Registration fee
- Student fee or waiver
- Publication options
- Journal review conditions
- Venue
- Accommodation recommendations
- Online or hybrid participation options
- Visa documentation, if required
Use the current official conference announcement rather than relying on an older call for papers.
Frequently Asked Questions About the EIBC Conference
What does EIBC conference stand for?
In this academic context, EIBC refers to the International Conference Economics, International Business and Cross-Cultural Communication organized by Alexandru Ioan Cuza University of Iași.
Where is the EIBC conference held?
The 2026 edition was held at the Faculty of Economics and Business Administration of Alexandru Ioan Cuza University in Iași, Romania, from June 11–13, 2026.
Is EIBC an international conference?
Yes. The organizers describe the event as an international conference intended to connect academic peers from Romania and abroad.
Can PhD students attend?
Yes. The 2026 edition offered a specific registration category for PhD students.
Can undergraduate and master’s students participate?
Yes. EIBC 2026 included a students’ session, and undergraduate and master’s students participating in that session were eligible for free registration.
Does EIBC offer publication opportunities?
Yes. The organizers listed several academic outlets as potential publication routes, along with dedicated conference proceedings. Journal submissions remain subject to the normal review process of the selected publication.
Are EIBC conference proceedings published?
The organizers state that papers may be published in the Conference Proceedings Economics, International Business and Cross-Cultural Communication, published by Alexandru Ioan Cuza University Press with ISSN 2810-4625.
Has the EIBC Conference 2026 already taken place?
Yes. EIBC 2026 ran from June 11 through June 13, 2026, so that edition has concluded. Researchers interested in attending should look for the announcement and deadlines for the next edition.
Final Thoughts on the EIBC Conference
The EIBC conference offers researchers a focused environment for discussing work across economics, international business, and cross-cultural communication. Its combination of research presentations, student participation, academic discussion, networking, and potential publication routes makes it particularly relevant for scholars whose work crosses disciplinary or international boundaries.
The best reason to attend, however, isn’t simply to collect another certificate. Use the conference strategically: bring a strong research question, seek difficult feedback, meet scholars working on related problems, and turn what you learn into a better manuscript.
EIBC 2026 has already concluded, but researchers considering a future edition should monitor official announcements for new dates, submission requirements, fees, and publication options before making travel or submission plans.

The eMetrics Summit was one of the formative conferences in web, digital, and marketing analytics. Created by analytics pioneer Jim Sterne, the event began in 2002 when organizations were still trying to answer a deceptively difficult question: how do you determine whether a website is actually successful? Data Driven Business
Over time, that question became much bigger. Businesses needed to connect website behavior with search, email, advertising, social media, customer experience, revenue, and eventually artificial intelligence. The conference expanded with the discipline itself and ultimately evolved into the Marketing Analytics Summit. Marketing Analytics Summit
For marketers and analysts researching the eMetrics Summit today, understanding that evolution is particularly useful. The event provides a window into how digital measurement moved from counting pageviews to supporting complex, data-informed business decisions.
eMetrics Summit Quick Facts
| Topic | Details |
|---|---|
| Founded | 2002 |
| Founder | Jim Sterne |
| First event | Santa Barbara, California |
| Original focus | Web analytics and website measurement |
| Later focus | Digital and marketing analytics |
| Industry connection | Closely associated with the development of the Digital Analytics Association |
| International reach | Events were held across major U.S. and European cities |
| Successor | Marketing Analytics Summit |
| Core audience | Analysts, marketers, optimization professionals, consultants, executives, and technology specialists |
Historical sources consistently place the first conference in Santa Barbara in 2002. The event subsequently expanded internationally as digital analytics developed into a recognized professional discipline. Data Driven Business
What Was the eMetrics Summit?
The eMetrics Summit was a professional conference centered on measuring and improving digital business performance.
Its early subject matter reflected the state of the internet industry at the beginning of the 2000s. Organizations had websites, online advertising was growing, and digital commerce was becoming important, but many businesses lacked mature systems for connecting online activity to meaningful business outcomes.
The summit provided a forum where practitioners, consultants, technology providers, and business leaders could exchange approaches to measurement.
According to an interview with founder Jim Sterne, the original conference centered on the basic question of how to measure website success. As digital channels multiplied, its scope expanded to areas such as email, search, social media, offline-to-online effects, and larger marketing datasets. Data Driven Business
That progression is important because it mirrors the history of digital analytics itself.
From website statistics to business decisions
Early web measurement often emphasized metrics such as:
- Visits and pageviews
- Click-through rates
- Traffic sources
- Conversion rates
- Website revenue
- Visitor behavior
- Campaign response
Those metrics remain useful, but sophisticated analytics teams eventually needed to answer more consequential questions.
Which marketing activities create incremental revenue? Which customer segments deserve additional investment? Where does the conversion journey break down? What should an organization optimize next?
The industry therefore moved gradually from reporting activity toward explaining performance and informing decisions.
The History of the eMetrics Summit
The first eMetrics Summit in 2002
Jim Sterne launched the first eMetrics Summit in Santa Barbara, California, in 2002. Sterne was already active in internet marketing and measurement, and the conference created a dedicated environment for professionals working on the emerging discipline of web analytics. Data Driven Business
At that point, analytics infrastructure looked very different from the modern ecosystem. Companies were still working out fundamental questions around data collection, definitions, reporting standards, attribution, and organizational ownership.
The summit consequently became more than a venue for discussing software. It helped practitioners exchange methods for turning digital data into business information.
International expansion
As web analytics matured, the eMetrics Summit expanded beyond its original California base.
Historical accounts identify eMetrics events in cities including San Francisco, Boston, New York, Washington, London, Berlin, Stockholm, Milan, and Toronto. Data Driven Business
London was already hosting an eMetrics Summit by 2006, with sessions examining web analytics, customer behavior, segmentation, measurement, and related topics. Marketingfacts
That international expansion reflected a wider change: digital measurement was no longer a niche concern confined to a handful of internet companies.
It was becoming a mainstream business capability.
eMetrics Summit and the Digital Analytics Association
One of the most significant parts of the conference’s legacy is its relationship with the professional analytics community.
As practitioners continued meeting and exchanging ideas, demand grew for a more permanent professional organization. Historical accounts connect the eMetrics community with the creation of what was initially the Web Analytics Association and later became the Digital Analytics Association. Data Driven Business
This mattered because an emerging profession needs more than tools.
It needs shared terminology, professional development, networking, methodological debate, ethical discussion, and mechanisms through which practitioners can exchange knowledge.
The eMetrics Summit helped create an environment where those relationships could develop.
What Topics Did the eMetrics Summit Cover?
The agenda changed as analytics technology and marketing practices evolved. That adaptability was one of the event’s defining characteristics.
Web and digital analytics
Website measurement formed the original foundation.
Practitioners needed to understand not simply how many people visited a website, but what those visitors did and whether their behavior contributed to organizational objectives.
That meant moving beyond raw traffic numbers toward metrics connected with outcomes.
Conversion optimization
Analytics becomes significantly more valuable when measurement leads to action.
Conversion optimization therefore represented a natural extension of web analytics. Teams could use behavioral evidence to identify friction, develop hypotheses, test changes, and evaluate the results.
The practical loop is straightforward:
Measure → diagnose → hypothesize → test → learn → optimize
That remains a useful analytics operating model today.
Customer segmentation
Not every visitor behaves in the same way.
Historical reporting from the 2006 London conference, for example, discussed the growing importance of personas and segmentation in understanding visitors rather than treating analytics simply as an exercise in counting clicks. OX2 Web Analytics Blog
Modern analytics has pushed that concept much further through behavioral cohorts, lifecycle segmentation, propensity models, customer data platforms, and personalization.
But the underlying principle remains the same: averages can hide strategically important differences between customers.
Search and campaign analytics
As digital acquisition expanded, analysts increasingly needed to connect campaigns with downstream outcomes.
That introduced questions involving acquisition costs, conversion quality, channel effectiveness, attribution, and return on marketing investment.
It also created one of the most persistent problems in marketing analytics: determining whether an observed conversion was actually caused by marketing activity.
Social and mobile measurement
The explosion of social networks and smartphones added additional customer touchpoints.
Businesses could no longer assume that a customer interacted with one campaign, on one desktop browser, before immediately converting.
Cross-channel and cross-device behavior made measurement considerably more complicated.
Predictive analytics and artificial intelligence
Later iterations of the conference reflected growing interest in more advanced analytics. By 2016, for example, eMetrics was being held alongside Predictive Analytics World, illustrating the increasing overlap between digital measurement and predictive methods. LinkedIn
The eventual Marketing Analytics Summit explicitly broadened its remit to include modern data and AI-related capabilities. Marketing Analytics Summit
Why the eMetrics Summit Mattered
Its importance cannot be explained simply by the number of presentations delivered.
The deeper contribution was helping establish analytics as a professional practice.
It emphasized outcomes over vanity metrics
A dashboard can contain hundreds of numbers without answering a single useful business question.
One of the lasting principles associated with the analytics community surrounding eMetrics was the need to connect measurement with organizational objectives.
That distinction remains critical.
A report might show:
Traffic increased by 18%.
An analytical interpretation asks:
Which audiences and channels generated the increase, did those visitors produce valuable outcomes, and should the business change its investment because of the result?
The second question is where analytics begins creating operational value.
It connected practitioners
Analytics professionals frequently face problems that cannot be solved by documentation alone.
Implementation inconsistencies, attribution limitations, stakeholder expectations, organizational politics, and data-quality problems all benefit from practitioner-to-practitioner knowledge sharing.
Long-time attendees have specifically highlighted the community and networking dimensions of eMetrics alongside its technical content. Concord USA
It brought practitioners and vendors together
Historical agendas show participation from professionals associated with major brands, technology companies, agencies, analytics firms, and consultancies. A 2014 San Francisco program, for example, included representatives associated with organizations such as FedEx, IBM, Adobe, Intuit, Motorola Mobility, Microsoft, and others. Bizzabo
That mixture mattered.
Vendors could demonstrate emerging capabilities, while practitioners could discuss what actually worked inside organizations.
eMetrics Summit vs. a Typical Marketing Conference
The distinction becomes clearer when comparing the conference with a broader marketing event.
| Area | eMetrics Summit Focus | General Marketing Conference |
|---|---|---|
| Primary emphasis | Measurement and analytics | Broad marketing strategy |
| Data depth | High | Varies |
| Web analytics | Core subject | Usually one topic |
| Optimization | Strong focus | Moderate |
| Attribution | Highly relevant | May be covered |
| Analytics implementation | Important | Less prominent |
| Audience | Analysts and data-driven marketers | Wider marketing audience |
| Networking value | Specialized analytics community | Broader professional network |
The eMetrics Summit was therefore especially relevant to people responsible for proving, diagnosing, or improving digital performance.
Who Attended the eMetrics Summit?
The audience evolved alongside the discipline.
Typical participants included digital analysts, marketing analysts, optimization specialists, marketing managers, data professionals, consultants, measurement strategists, product professionals, agency teams, and executives responsible for digital performance.
The conference could therefore serve different levels of analytical maturity.
A newer practitioner might learn how to define meaningful KPIs. An experienced analyst might be more interested in attribution, experimentation, data integration, organizational analytics maturity, or communicating insights to senior management.
The Evolution Into Marketing Analytics Summit
One of the most important points for anyone searching for the eMetrics Summit today is that the name belongs primarily to the conference’s earlier era.
The field had changed dramatically since 2002.
Websites were no longer isolated digital properties. Customer journeys crossed search engines, apps, social platforms, advertising networks, email, ecommerce systems, CRM platforms, physical stores, and other touchpoints.
The conference eventually broadened accordingly.
Historical accounts place the transition from eMetrics Summit to Marketing Analytics Summit around the end of 2018, reflecting a wider emphasis on marketing data rather than web analytics alone. Bitmat
Jim Sterne’s description of the successor event similarly explains that eMetrics had originally been created to bring early web analytics practitioners together, while Marketing Analytics Summit was designed for a world in which analytics had become central to marketing. Marketing Analytics Summit
eMetrics Summit vs. Marketing Analytics Summit
| eMetrics Summit | Marketing Analytics Summit |
|---|---|
| Originated in web analytics | Broader marketing analytics scope |
| Website measurement was foundational | Cross-channel measurement is central |
| Emerged in early digital marketing era | Reflects mature data-driven marketing |
| Clickstream and digital behavior were major concerns | Customer, marketing, data, and AI capabilities converge |
| Built an early analytics community | Extends that community into modern marketing analytics |
The change was therefore more than a rebranding exercise.
It reflected a fundamental shift in the underlying profession.
Lessons Modern Marketers Can Still Take From eMetrics
The technologies have changed dramatically since 2002. Several measurement principles have not.
1. Start with the business question
A common analytics mistake is opening a dashboard before defining the decision that needs to be made.
Reverse that process.
First ask what the organization needs to know. Then determine which data can answer the question.
2. Do not confuse metrics with insight
Metrics describe.
Analysis explains.
Insight identifies something meaningful enough to change a decision or action.
That distinction prevents analytics teams from becoming reporting factories.
3. Treat data quality as a strategic issue
A sophisticated dashboard built on unreliable tracking remains unreliable.
Before using metrics for consequential decisions, teams should establish definitions, ownership, instrumentation standards, validation processes, and governance.
4. Measure outcomes, not just activity
Impressions, sessions, clicks, views, and engagement can help diagnose performance, but they are rarely sufficient as final measures of business success.
Where possible, connect activity with outcomes such as qualified leads, purchases, retention, revenue, customer lifetime value, or another objective appropriate to the organization.
5. Add context to every KPI
A number without context is difficult to interpret.
For example, a 4.2% conversion rate may look impressive or disappointing depending on historical performance, customer segment, channel, device, campaign economics, and the definition of a conversion.
Strong analysts establish the comparison before interpreting the number.
Common Analytics Mistakes the eMetrics Philosophy Helps Expose
Even sophisticated organizations repeatedly encounter the same measurement problems.
One is dashboard overload. More charts do not automatically create more insight.
Another is metric inconsistency. If finance, marketing, product, and analytics teams define a customer or conversion differently, meetings become arguments over definitions instead of discussions about performance.
Attribution is another danger. A model can distribute conversion credit mathematically without proving that a channel caused the conversion.
Organizations also frequently optimize local metrics while damaging the larger business outcome. A campaign might maximize leads, for example, while producing low-quality prospects that sales cannot convert.
The practical lesson is simple: analytics should optimize the decision system, not merely the dashboard.
How to Build an eMetrics-Inspired Measurement Framework
A modern organization can apply the conference’s measurement-first philosophy without adopting any particular analytics platform.
Step 1: Define the objective
Start with the business result.
For an ecommerce company, that might be profitable customer growth rather than website traffic.
Step 2: Define decision questions
Determine what stakeholders actually need to decide.
Examples include:
- Which acquisition channels deserve additional investment?
- Where are customers abandoning checkout?
- Which campaigns acquire customers with the highest lifetime value?
- Which product changes improve retention?
Step 3: Build a KPI hierarchy
Separate metrics by purpose.
Business outcomes: revenue, profit, retention, customer lifetime value.
Performance indicators: conversion rate, qualified leads, repeat purchase rate.
Diagnostic metrics: landing-page engagement, checkout abandonment, page speed, campaign click-through rate.
This hierarchy prevents diagnostic numbers from being mistaken for ultimate objectives.
Step 4: Establish reliable data collection
Document every critical event, source, definition, owner, and validation procedure.
Do this before building elaborate reports.
Step 5: Segment the results
Company-wide averages frequently hide the explanation.
Break performance down by relevant dimensions such as channel, customer type, geography, device, product category, lifecycle stage, or acquisition cohort.
Step 6: Convert findings into decisions
Every important analysis should ideally end with four elements:
Finding → interpretation → recommended action → measurement plan
That final measurement plan closes the loop by defining how the organization will know whether the action worked.
The eMetrics Summit Legacy in the AI Era
Marketing analytics is now entering another major transition.
Generative AI can summarize reports, produce queries, assist with data exploration, identify anomalies, and make sophisticated analytical capabilities accessible to more employees.
But AI does not eliminate the foundational problems that conferences such as eMetrics spent years discussing.
An AI system still needs trustworthy data. It still needs coherent definitions. Correlation still does not automatically establish causation. A model can still optimize the wrong KPI.
In fact, cheaper and faster analysis can make measurement governance more important, not less.
When generating another analysis costs almost nothing, the scarce resource becomes judgment: knowing which question deserves to be asked, which evidence can answer it, and what decision should follow.
That may be the most relevant eMetrics lesson of all.
Frequently Asked Questions
What is the eMetrics Summit?
The eMetrics Summit was a professional conference focused on web, digital, and marketing analytics. It began in 2002 and helped bring together practitioners working on digital measurement and optimization. Data Driven Business
Who founded the eMetrics Summit?
Jim Sterne founded the eMetrics Summit. He was an early internet marketing and analytics practitioner and was closely involved in the development of the professional digital analytics community. Marketing Analytics Summit
When did the eMetrics Summit begin?
The first eMetrics Summit was held in 2002 in Santa Barbara, California. Data Driven Business
What happened to the eMetrics Summit?
The conference evolved as web analytics expanded into broader digital and marketing measurement. By the end of 2018, the eMetrics legacy had transitioned into the Marketing Analytics Summit, reflecting the wider role of analytics across marketing. Bitmat
Was eMetrics only about web analytics?
No. Web analytics was its original foundation, but its subject matter expanded to include areas such as search, email, social media, marketing measurement, optimization, customer behavior, and broader data-driven decision-making. Data Driven Business
Why was the eMetrics Summit important?
It provided a specialized environment where analytics practitioners could exchange methods, learn from real implementations, examine emerging technologies, and build professional relationships. It was also closely connected with the community from which the Web Analytics Association—later the Digital Analytics Association—developed. Data Driven Business
Final Thoughts on the eMetrics Summit
The eMetrics Summit occupies an important place in the history of digital analytics because it emerged when businesses were still learning how to measure the commercial value of the web.
Its subject matter evolved from website measurement into conversion optimization, customer analytics, cross-channel marketing measurement, predictive methods, and the broader discipline now associated with marketing analytics.
The tools have changed. The volume of data has exploded. Artificial intelligence is changing analytical workflows again.
Yet the central challenge remains remarkably familiar: collect trustworthy evidence, interpret it in context, and use it to make better decisions.
That principle explains both the historical significance of the eMetrics Summit and why its measurement-first philosophy remains relevant to modern marketers, analysts, and data-driven organizations.


imageflings.com: What It Is, Website Status, Safety, and Everything You Should Know

TeamViewer Pricing vs. Splashtop: Complete 2026 Comparison Guide

What Is Globalunpaid Com? Complete Website Guide for 2026
-

 Fashion9 years ago
These ’90s fashion trends are making a comeback in 2017
-
Entertainment9 years ago
The final 6 ‘Game of Thrones’ episodes might feel like a full season
-
Fashion9 years ago
According to Dior Couture, this taboo fashion accessory is back
-
Business9 years ago
Uber and Lyft are finally available in all of New York State
-
Entertainment9 years ago
The old and New Edition cast comes together to perform
-
Sports9 years ago
Steph Curry finally got the contract he deserves from the Warriors
-
Sports9 years ago
Phillies’ Aaron Altherr makes mind-boggling barehanded play
-
Entertainment9 years ago
Disney’s live-action Aladdin finally finds its stars